About Me

My photo
NISM Certified Research Analyst & Mutual Fund Distributor.

Thursday, 15 March 2018

Fortis Health Care : Technical View


The counter has been in lime light for the last few weeks and lot of buzz is going around it. The recent wild gyrations must have scared even the most experienced traders or investors. However as with the passage of time things seem to be settling down our team took an opportunity to offer a technical view on the counter which may prove useful to the traders.

The counter has been flirting with its 200 DMA during most recent past. However it again gained its 200 DMA with bang i.e. with a gap up opening. The counter is also trading above its 20 & 50 DMA and 20 DMA has crossed 50 DMA. During today's session 20 DMA has kissed 200 DMA. On a daily time frame MACD has turned bullish above zero line with RSI above 60. On a weekly time frame the counter has formed a strong bullish candle so far and has given a close above its 200 WMA. All these technical factors are clearly giving strong bullish signal for the short to medium term. In view of these technical observations we expect the counter to witness strong momentum in Northward direction. Traders can bet on the counter with SL below 150 for the TGTs of 172-178.


Monday, 12 March 2018

Lupin : A possible Reversal on the card?


The counter has been in a downtrend and has corrected nearly 65% from its peak. The bears showed no mercy for any support and killed all bulls that came along to provide the support.The big bull Mr. Rakesh Jhunjhunwala also said to have increased the stake during recent past.  Even the promoters of the company went on buying spree during the month of November or December and bought healthy quantities around 830 levels.Though the stock did show some recovery (perhaps due to these variable) it proved only short lived and again the counter entered the downtrend and made fresh 52 week low of Rs.750.15.

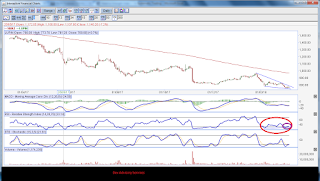
The counter is currently trading around 770 levels around 2.6% higher above its recent 52 week low of 750.15. We can see the some base formation exercise now around 755-760 zone. Even during today's session the counter formed a doji candlestick. Looking at the recent price actions we tried to analyse the counter mainly using RSI as a Technical tool. Though the counter made lower low, RSI didn't respond the same way as we can see the higher low of RSI. Technically it is referred to as Bullish RSI Divergence. Another important observation is that we can see the Bullish Failure Swing of RSI i.e. RSI went below 30, bounced above 30, pulled back but held 30 level and broke its prior high. All these RSI observations clearly hint toward a possible reversal in short term. If the analysis turns out to be correct we may see possible bounce towards 830-840 in a short to medium term.

Hence in view of the above observations traders may try to long the counter at current price around 770 with SL of 750 for the TGTs of 830-840. The risk:reward too looks attractive at this level. Worth betting, isn't it?